WebSurfer's Home

トップ > Blog 1   |   ログイン
APMLフィルター

Chart の X 軸マージン

by WebSurfer 2022年9月9日 18:44

Chart の X 軸にはデフォルトでグラフの左右にマージンが表示されます。下の Chart サンプルの画像を見てください。X 軸の端にはデータはないのですが自動的に 0 と 10 というラベルが追加されています。
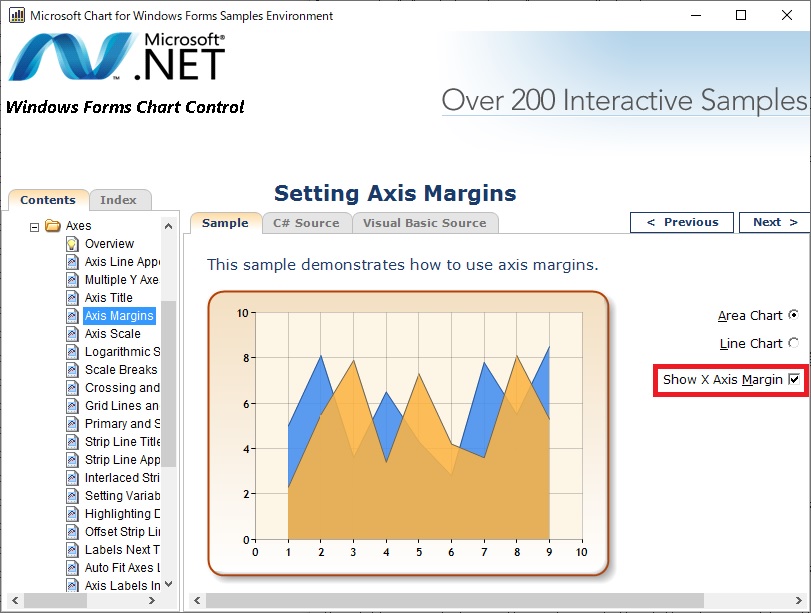
Axis Margins

データがないのに X 軸にラベルが表示されること、さらには、例えば数字が月を表しているような場合は存在しない月「0」を表示するのは好ましくなさそうです。

必要のない X 軸のマージンやラベルを表示しないようにする方法を調べましたので、以下に備忘録として書いておきます。

(1) Axis Margins

簡単なのは ChartArea.AxisX.IsMarginVisible プロパティを false に設定することです。上の画像の Chart サンプルで false に設定すると以下のようになります。
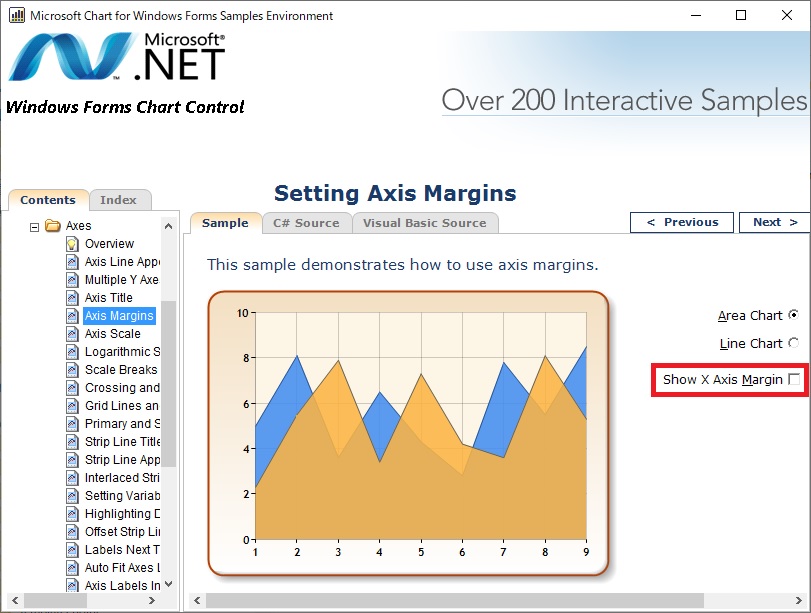
IsMarginVisible を false に設定

上の画像のような折れ線グラフのような場合はこれが簡単でよさそうです。

しかし、棒グラフのような場合は、上の画像で言うと X 軸の 1 と 9 上の棒の半分が見切れてしまいます。その場合は下に述べる CustomLabel を使用するのが良さそうです。

(2) Custom Labels

先の記事「WPF で Chart を表示」のコードでは以下の画像のように Chart の X 軸に 0 と 7 が表示されてしまいました。
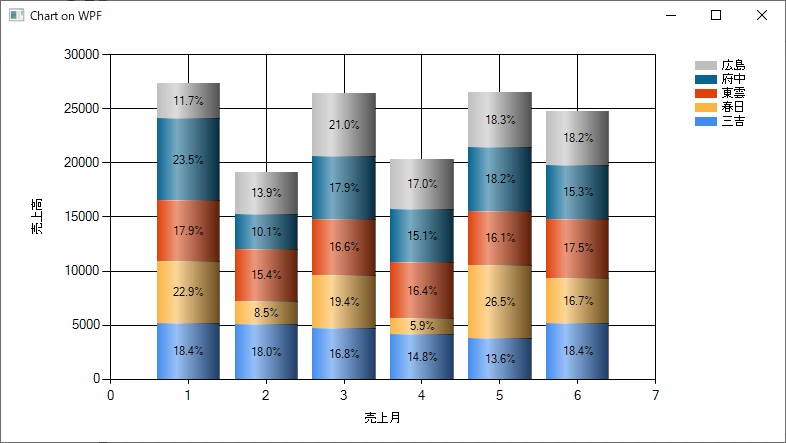
WPF アプリに Chart 表示

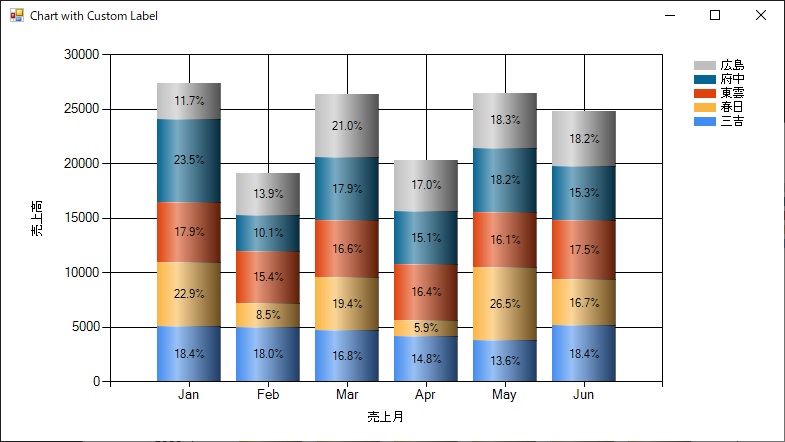
それを CustomLabel クラスを使って以下ようにしてみました。

CustomLabel の使用

そのコードは以下の通りです。基本的には先の記事とほとんど同じで、下の方に「// CostomLabel の設定」とコメントした部分のコードを追加しただけです。

using System;
using System.Collections.Generic;
using System.Data;
using System.Data.SqlClient;
using System.Windows.Forms;
using System.Windows.Forms.DataVisualization.Charting;

namespace WindowsFormsApp1
{
    public partial class Form8 : Form
    {
        private readonly Chart chart;

        public Form8()
        {
            InitializeComponent();

            this.chart = new Chart
            {
                Name = "chart1",
                Dock = DockStyle.Fill
            };

            this.Controls.Add(chart);
        }

        private void Form8_Load(object sender, EventArgs e)
        {
            Legend legend = new Legend()
            {
                DockedToChartArea = "ChartArea1",
                IsDockedInsideChartArea = false,
                Name = "Legend1"
            };

            chart.Legends.Add(legend);

            Series series = new Series()
            {
                Name = "三吉",
                ChartType = SeriesChartType.StackedColumn,
                CustomProperties = "DrawingStyle=Cylinder",
                IsValueShownAsLabel = true,
                Label = "#PERCENT{P1}",
                Legend = "Legend1",
                XValueMember = "Month",
                YValueMembers = "三吉"
            };
            chart.Series.Add(series);

            series = new Series()
            {
                Name = "春日",
                ChartType = SeriesChartType.StackedColumn,
                CustomProperties = "DrawingStyle=Cylinder",
                IsValueShownAsLabel = true,
                Label = "#PERCENT{P1}",
                Legend = "Legend1",
                XValueMember = "Month",
                YValueMembers = "春日"
            };
            chart.Series.Add(series);

            series = new Series()
            {
                Name = "東雲",
                ChartType = SeriesChartType.StackedColumn,
                CustomProperties = "DrawingStyle=Cylinder",
                IsValueShownAsLabel = true,
                Label = "#PERCENT{P1}",
                Legend = "Legend1",
                XValueMember = "Month",
                YValueMembers = "東雲"
            };
            chart.Series.Add(series);

            series = new Series()
            {
                Name = "府中",
                ChartType = SeriesChartType.StackedColumn,
                CustomProperties = "DrawingStyle=Cylinder",
                IsValueShownAsLabel = true,
                Label = "#PERCENT{P1}",
                Legend = "Legend1",
                XValueMember = "Month",
                YValueMembers = "府中"
            };
            chart.Series.Add(series);

            series = new Series()
            {
                Name = "広島",
                ChartType = SeriesChartType.StackedColumn,
                CustomProperties = "DrawingStyle=Cylinder",
                IsValueShownAsLabel = true,
                Label = "#PERCENT{P1}",
                Legend = "Legend1",
                XValueMember = "Month",
                YValueMembers = "広島"
            };
            chart.Series.Add(series);

            ChartArea chartArea = new ChartArea()
            {
                Name = "ChartArea1",
                AxisY = new Axis() { Title = "売上高" },
                AxisX = new Axis() { Title = "売上月" }
            };
            chart.ChartAreas.Add(chartArea);

            // CostomLabel の設定
            var dic = new Dictionary<int, string>
            {
                { 1, "Jan" }, { 2, "Feb" }, { 3, "Mar" }, { 4, "Apr" },
                { 5, "May" }, { 6, "Jun" }, { 7, "Jul" }, { 8, "Aug" },
                { 9, "Sep" }, { 10, "Oct" }, { 11, "Nov" }, { 12, "Dec" }
            };
            DataTable table = CreateDataTable();
            foreach (DataRow row in table.Rows)
            {
                int m = (int)row["Month"];
                chartArea.AxisX.CustomLabels.Add(m - 0.5d, m + 0.5d, dic[m]);
            }

            chart.DataSource = table.DefaultView;
        }

        private DataTable CreateDataTable()
        {
            string connString = @"接続文字列";
            string selectQuery = @"SELECT Month, 
                SUM(CASE WHEN Name = N'三吉' THEN Sales ELSE 0 END) AS 三吉,
                SUM(CASE WHEN Name = N'春日' THEN Sales ELSE 0 END) AS 春日,
                SUM(CASE WHEN Name = N'東雲' THEN Sales ELSE 0 END) AS 東雲,
                SUM(CASE WHEN Name = N'府中' THEN Sales ELSE 0 END) AS 府中,
                SUM(CASE WHEN Name = N'広島' THEN Sales ELSE 0 END) AS 広島
                FROM Shop GROUP BY Month";

            using (var connection = new SqlConnection(connString))
            {
                using (var command = new SqlCommand(selectQuery, connection))
                {
                    var adapter = new SqlDataAdapter(command);
                    var table = new DataTable();
                    adapter.Fill(table);
                    return table;
                }
            }
        }        
    }
}

上のコードの「// CostomLabel の設定」とコメントした部分を説明します。

CreateDataTable メソッドの中の SELECT クエリからは以下の結果が得られ、それが DataTable に格納されて返されます。
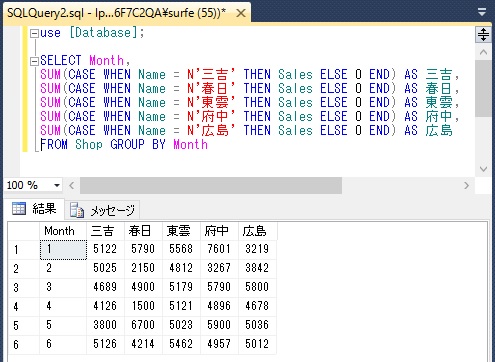
SELECT クエリの結果

その DataTable の Month 列のデータを使って CustomLabel を生成し AxisX.CustomLabels で取得できる CustomLabelsCollection オブジェクトに追加しています。

Add メソッドの第 1 引数は CustomLabel.FromPosition を、第 2 引数は CustomLabel.ToPosition を設定します。それらは Midrosoft のドキュメント「CustomLabel.FromPosition プロパティ」に以下のように書いてある通りラベルの表示位置を設定するものです。

"The difference between the values of the ToPosition and FromPosition properties determines where the label text will be displayed. For example, suppose the X-axis has a scale that ranges from 1 to 5 (1, 2 ,3 , 4, 5). In order to display a custom label just underneath the second point, you would set the ToPosition property to 1.5 and the FromPosition property to 2.5."

Add メソッドの第 3 引数はラベルのテキストを設定するものです。上のコードでは Dictionary を作って Month 列の int 型の数字を Jan, Feb, Mar ... という文字列にしています。

Tags: , ,

.NET Framework

Chart の注釈のサイズ・位置設定

by WebSurfer 2022年7月10日 18:16

Windows Forms アプリ用の Chart の注釈 (Annotation) のサイズと位置の設定方法を備忘録として以下に書いておきます。

サイズは Annotation.Width プロパティAnnotation.Height プロパティで、位置は Annotation.X プロパティAnnotation.Y プロパティ で設定します。

分かりにくかったのが (1) 相対 Chart 座標 (relative chart coordinates) と (2) 軸座標 (axes coordinates) という 2 つの方法があって、それぞれ設定するものが全く違うということでした。

(1) 相対 Chart 座標 (relative chart coordinates)

これがデフォルトだそうです。

サイズは、Annotation.Width, Annotation.Height にそれぞれ Chart.Width, Chart.Height のパーセント値を設定します。例えば、注釈の幅を Chart 本体の 50% に設定したい場合は Annotation.Width に 50 を設定します。

位置もやはり Chart.Width, Chart.Height のパーセント値で設定します。例えば、注釈の左端を Chart 本体の左端から 10% 右の位置に設定したい場合は Annotation.X に 10 を設定します。

下の画像がその例で、長方形の注釈 (RectangleAnnotation) のサイズを Chart 本体のサイズの 50% に、注釈の左上端の位置を Char 本体の左上端から 10% 右下に設定しています。

相対 Chart 座標 (relative chart coordinates)

上の画像を表示するのに使ったサンプルコードをこの記事の下の方に載せておきます。

(2) 軸座標 (axes coordinates)

Microsoft のドキュメントによると「軸座標 (axes coordinates)」にするには AxisX プロパティAxisY プロパティを設定し、IsSizeAlwaysRelative プロパティを false に設定するのだそうです。そうすると、注釈のサイズ・位置は X, Y 軸目盛が基準になります。

サイズは、例えば幅を X 軸 2 目盛分にしたい場合は Annotation.Width に 2 を設定します。高さも同様で、Y 軸 2 目盛分にしたい場合は Annotation.Height に 2 を設定します。

位置は、例えば注釈の左端を X 軸目盛の 1 の位置にしたい場合は annotation.X に 1 を設定します。上下位置も同様で、注釈の下端を Y 軸目盛の 1 の位置をにしたい場合は annotation.Y に 1 を設定します。

下の画像がその例で、長方形の注釈 (RectangleAnnotation) のサイズを X, Y 軸 2 目盛分に、注釈の左下端の位置を X, Y 軸目盛の 1 に設定しています。

軸座標 (axes coordinates)

X, Y 軸の目盛がベースになるので、上の画像の ComboBox の選択を変えて X, Y 軸を変えるとそれに応じて注釈のサイズ・位置も変わって、設定が意味をなさなくなりますので注意してください。


以下にサンプルコードを載せておきます。CreateAnnotation メソッドの中でコメントアウトしてるのが「(1) 相対 Chart 座標 (relative chart coordinates)」のものです。

using System;
using System.Data;
using System.Windows.Forms.DataVisualization.Charting;
using System.Windows.Forms;

namespace WindowsFormsApp1
{
    public partial class Form6 : Form
    {
        private Chart chart1;
        private DataTable table;

        public Form6()
        {
            InitializeComponent();

            chart1 = new Chart
            {
                Location = new System.Drawing.Point(50, 50),
                Width = 600,
                Height = 300
            };
            Controls.Add(chart1);
        }

        private void Form6_Load(object sender, EventArgs e)
        {
            // ここでは Chart は作らない。下の「コンボボックスの初期値を
            // 設定」のところで ComboBox.SelectedIndexChangedイベントが
            // 発生するので、ここで Chart を作るとイベントハンドラでも
            // Chart が作られて意味不明な動きになる。

            // グラフのデータ作成。X軸 3 通りと Y軸 3 通りを ComboBox の
            // 選択で切り替えて表示する
            table = new DataTable();
            table.Columns.Add("A", typeof(double));
            table.Columns.Add("B", typeof(double));
            table.Columns.Add("C", typeof(double));
            table.Rows.Add(new Object[] { 1, 5000000, 55 });
            table.Rows.Add(new Object[] { 2, 4000000, 44 });
            table.Rows.Add(new Object[] { 3, 3000000, 33 });

            // コンボボックスに DataTable の列名を格納
            comboBoxX.Items.AddRange(new string[] { "A", "B", "C" });
            comboBoxY.Items.AddRange(new string[] { "A", "B", "C" });

            // コンボボックスの初期値を設定
            comboBoxX.SelectedIndex = 0;
            comboBoxY.SelectedIndex = 0;
        }

        private void comboBoxX_SelectedIndexChanged(object sender, EventArgs e)
        {
            //コンボボックスで選択した DataTable の列名を読み込む
            object Select_X = comboBoxX.SelectedItem;
            object Select_Y = comboBoxY.SelectedItem;

            // Form_Load の comboBox1.SelectedIndex = 0; でイベントが発生
            // した時は comboBox2.SelectedItem は null なので何もしない
            if (Select_X == null || Select_Y == null) return;

            var X_Data = Select_X.ToString();
            var Y_Data = Select_Y.ToString();

            chart1.Series.Clear();
            chart1.ChartAreas.Clear();

            ChartArea chartArea = new ChartArea();
            chart1.ChartAreas.Add(chartArea);

            Series series1 = new Series();

            // ComboBox 選択された列名を軸ラベルに設定する
            chart1.ChartAreas[0].AxisX.Title = X_Data;
            chart1.ChartAreas[0].AxisY.Title = Y_Data;

            // データを Chart 上にグラフとして表示
            for (int i = 0; i < table.Rows.Count; i++)
            {
                series1.Points.AddXY(table.Rows[i][X_Data], table.Rows[i][Y_Data]);
            }
            chart1.Series.Add(series1);

            // RectangleAnnotation を追加
            chart1.Annotations.Clear();
            chart1.Annotations.Add(CreateAnnotation());
        }

        private void comboBoxY_SelectedIndexChanged(object sender, EventArgs e)
        {
            //コンボボックスで選択した DataTable の列名を読み込む
            object Select_X = comboBoxX.SelectedItem;
            object Select_Y = comboBoxY.SelectedItem;

            // Form_Load の「コンボボックスの初期値を設定」順であれば null
            // になることはなさそうだが念のため
            if (Select_X == null || Select_Y == null) return;

            var X_Data = Select_X.ToString();
            var Y_Data = Select_Y.ToString();

            chart1.Series.Clear();
            chart1.ChartAreas.Clear();

            ChartArea chartArea = new ChartArea();
            chart1.ChartAreas.Add(chartArea);

            Series series1 = new Series();

            // ComboBox 選択された列名を軸ラベルに設定する
            chart1.ChartAreas[0].AxisX.Title = X_Data;
            chart1.ChartAreas[0].AxisY.Title = Y_Data;

            // データを Chart 上にグラフとして表示
            for (int i = 0; i < table.Rows.Count; i++)
            {
                series1.Points.AddXY(table.Rows[i][X_Data], table.Rows[i][Y_Data]);
            }
            chart1.Series.Add(series1);

            // RectangleAnnotation を追加
            chart1.Annotations.Clear();
            chart1.Annotations.Add(CreateAnnotation());
        }

        private Annotation CreateAnnotation()
        {
            var annotation = new RectangleAnnotation();

            // 相対 Chart 座標 (relative chart coordinates)
            // AnchorDataPoint, AxisX, AxisY は設定しない
            //annotation.X = 10d;         // Chart の左端から 10% 右の位置
            //annotation.Y = 10d;         // Chart の上端から 10% 下の位置
            //annotation.Width = 50d;     // Chart.Width の 50% の幅
            //annotation.Height = 50d;    // Chart.Height の 50% の高さ            

            // 軸座標 (axes coordinates)
            // AxisX, AxisY を設定。IsSizeAlwaysRelative を false に設定
            annotation.AxisX = chart1.ChartAreas[0].AxisX;
            annotation.AxisY = chart1.ChartAreas[0].AxisY;
            annotation.IsSizeAlwaysRelative = false;
            annotation.X = 1d;          // X 軸目盛の 1 の位置が注釈の左端
            annotation.Y = 1d;          // Y 軸目盛の 1 の位置が注釈の下端
            annotation.Width = 2d;      // X 軸の 2 目盛分の幅
            annotation.Height = 2d;     // Y 軸の 2 目盛分の幅

            annotation.Text = "I am a\nRectangleAnnotation";
            annotation.ForeColor = System.Drawing.Color.Black;
            annotation.Font = new System.Drawing.Font("Arial", 12); ;
            annotation.LineWidth = 2;
            annotation.BackColor = System.Drawing.Color.PaleGreen;
            annotation.LineDashStyle = ChartDashStyle.Dash;

            return annotation;
        }
    }
}

Tags: , ,

.NET Framework

.NET 6.0 WinForms アプリで Chart

by WebSurfer 2022年6月4日 14:44

Visual Studio 2022 で作成する .NET 6.0 の Windows Forms アプリで Chart を使って、先の記事「WPF で Chart を表示」と同じ棒グラフを表示してみました。

.NET 6.0 WinForms アプリに Chart 表示

調べてみると System.Windows.Forms.DataVisualization は .NET Core/.NET ではサポートされてないようです。そこを何とかしようとすると、自力でライブラリに手を加えるなどするしかなさそうですがそれは自分には無理なので、先人が作ってくれたライブラリに頼ることにしました。

で、NuGet を探してみるとこの記事を書いた時点では Maikebing.System.Windows.Forms.DataVisualization と HIC.System.Windows.Forms.DataVisualization という 2 つのパッケージが見つかりました。

ただしいずれも .NET 5.0 用とのこと。一旦はそこで断念したのですが、試しに前者の NuGet パッケージをインストールしてやってみました。その結果が上の画像で、この記事に書いた範囲に限っては一応は期待通りの結果になっています。

詳しく検証はしていませんので .NET Framework 版と同じ機能がサポートされているか、実用上問題ないのか等は分かりませんが、せっかくなのでブログの記事として残しておくことにしました。

プロジェクトの作成に使ったのは Visual Studio Community 2022 のテンプレート「Windows フォー��アプリ」で、フレームワークは .NET 6.0 です。

まず Maikebing.System.Windows.Forms.DataVisualization を NuGet からインストールします。この記事を書いた時点では v5.0.1 が最新でしたのでそれをインストールしました。

NuGet パッケージ

後者の Microsoft.Data.SqlClient は SQL Server からデータを取得して DataTable を作成するためのものです。以前は System.Data.SqlClient を使っていたのですが代えてみました。(後述しますが、おかげでトラブりました)

自動生成された Form1.cs のデザイン画面でツールボックスから Button をドラッグ&ドロップし Click イベントのハンドラを生成したら、Form1.cs のコード画面で以下のコードを実装します。先の記事「WPF で Chart を表示」のコードと同じです。これを実行した結果がこの記事の一番上の画像です。

using System.Data;
using Microsoft.Data.SqlClient;
using System.Windows.Forms.DataVisualization.Charting;

namespace WinFormsChart
{
    public partial class Form1 : Form
    {
        private Chart chart;

        public Form1()
        {
            InitializeComponent();

            this.chart = new Chart
            {
                Name = "chart1",
                Width = 600,
                DataSource = CreateDataTable().DefaultView
            };

            this.Controls.Add(chart);

            Legend legend = new Legend()
            {
                DockedToChartArea = "ChartArea1",
                IsDockedInsideChartArea = false,
                Name = "Legend1"
            };

            chart.Legends.Add(legend);

            Series series = new Series()
            {
                Name = "三吉",
                ChartType = SeriesChartType.StackedColumn,
                CustomProperties = "DrawingStyle=Cylinder",
                IsValueShownAsLabel = true,
                Label = "#PERCENT{P1}",
                Legend = "Legend1",
                XValueMember = "Month",
                YValueMembers = "三吉"
            };
            chart.Series.Add(series);

            series = new Series()
            {
                Name = "春日",
                ChartType = SeriesChartType.StackedColumn,
                CustomProperties = "DrawingStyle=Cylinder",
                IsValueShownAsLabel = true,
                Label = "#PERCENT{P1}",
                Legend = "Legend1",
                XValueMember = "Month",
                YValueMembers = "春日"
            };
            chart.Series.Add(series);

            series = new Series()
            {
                Name = "東雲",
                ChartType = SeriesChartType.StackedColumn,
                CustomProperties = "DrawingStyle=Cylinder",
                IsValueShownAsLabel = true,
                Label = "#PERCENT{P1}",
                Legend = "Legend1",
                XValueMember = "Month",
                YValueMembers = "東雲"
            };
            chart.Series.Add(series);

            series = new Series()
            {
                Name = "府中",
                ChartType = SeriesChartType.StackedColumn,
                CustomProperties = "DrawingStyle=Cylinder",
                IsValueShownAsLabel = true,
                Label = "#PERCENT{P1}",
                Legend = "Legend1",
                XValueMember = "Month",
                YValueMembers = "府中"
            };
            chart.Series.Add(series);

            series = new Series()
            {
                Name = "広島",
                ChartType = SeriesChartType.StackedColumn,
                CustomProperties = "DrawingStyle=Cylinder",
                IsValueShownAsLabel = true,
                Label = "#PERCENT{P1}",
                Legend = "Legend1",
                XValueMember = "Month",
                YValueMembers = "広島"
            };
            chart.Series.Add(series);

            ChartArea chartArea = new ChartArea()
            {
                Name = "ChartArea1",
                AxisY = new Axis() { Title = "売上高" },
                AxisX = new Axis() { Title = "売上月" }
            };
            chart.ChartAreas.Add(chartArea);
        }


        private DataTable CreateDataTable()
        {
            string connString = @"接続文字列";
            string selectQuery = @"SELECT Month, 
                SUM(CASE WHEN Name = N'三吉' THEN Sales ELSE 0 END) AS 三吉,
                SUM(CASE WHEN Name = N'春日' THEN Sales ELSE 0 END) AS 春日,
                SUM(CASE WHEN Name = N'東雲' THEN Sales ELSE 0 END) AS 東雲,
                SUM(CASE WHEN Name = N'府中' THEN Sales ELSE 0 END) AS 府中,
                SUM(CASE WHEN Name = N'広島' THEN Sales ELSE 0 END) AS 広島
                FROM Shop GROUP BY Month";

            using (SqlConnection connection = new SqlConnection(connString))
            {
                using (SqlCommand command = new SqlCommand(selectQuery, connection))
                {
                    SqlDataAdapter adapter = new SqlDataAdapter(command);
                    DataTable table = new DataTable();
                    adapter.Fill(table);
                    return table;
                }
            }
        }

        private void button1_Click(object sender, EventArgs e)
        {
            SaveFileDialog saveFileDialog1 = new SaveFileDialog();

            saveFileDialog1.Filter = "BMP形式|*.bmp|JPEG形式|*.jpeg|PNG形式|*.png";
            saveFileDialog1.FilterIndex = 2;
            saveFileDialog1.RestoreDirectory = true;

            if (saveFileDialog1.ShowDialog() == DialogResult.OK)
            {
                string filename = saveFileDialog1.FileName;
                string ext = Path.GetExtension(filename).ToLower();
                ChartImageFormat format;
                if (ext == ".jpeg")
                {
                    format = ChartImageFormat.Jpeg;
                }
                else if (ext == ".png")
                {
                    format = ChartImageFormat.Png;
                }
                else if (ext == ".bmp")
                {
                    format = ChartImageFormat.Bmp;
                }
                else
                {
                    throw new InvalidOperationException();
                }
                this.chart.SaveImage(filename, format);
            }
        }
    }
}

最後に、この記事の Chart の話とは関係ないことですが、System.Data.SqlClient に代えて Microsoft.Data.SqlClient を使ってトラブったのでそれを忘れないように書いておきます。

同じ .NET6.0 フレームワークで上と全く同じコードで System.Data.SqlClient の時は何ら問題なかったのに、Microsoft.Data.SqlClient を使うと以下の例外がスローされます。

SqlClient の例外

Microsoft.Data.SqlClient.SqlException A connection was successfully established with the server, but then an error occurred during the login process. (provider: SSL Provider, error: 0 - 信頼されていない機関によって証明書チェーンが発行されました。)

上のエラーメッセージでググってみると Microsoft のドキュメント ログイン フェーズのエラー が見つかって、それには考えられる原因として「SQL Server で TLS 1.2 がサポートされていない」と書いてあります。

確かにその通りで、接続先の SQL Server 2012 のバージョンは 11.0.2100 で TSL 1.2 はサポートしてないです。

別の Microsoft のドキュメント New features in 4.0 によると v4.0 からデフォルトで暗号化を行うよう設定が変わったとのことで、それが影響しているようです。

接続先を LocalDB v13.0.4001 (TLS 1.2 がサポートされている SQL Server 2016 相当)に変更して上の問題は解決できました。

Tags: , ,

CORE

About this blog

2010年5月にこのブログを立ち上げました。主に ASP.NET Web アプリ関係の記事です。

Calendar

<<  2024年4月  >>
31123456
78910111213
14151617181920
21222324252627
2829301234
567891011

View posts in large calendar